DS5 series AE system
The world's first USB3.0 interface DS5 series AE system
 |
 |
|
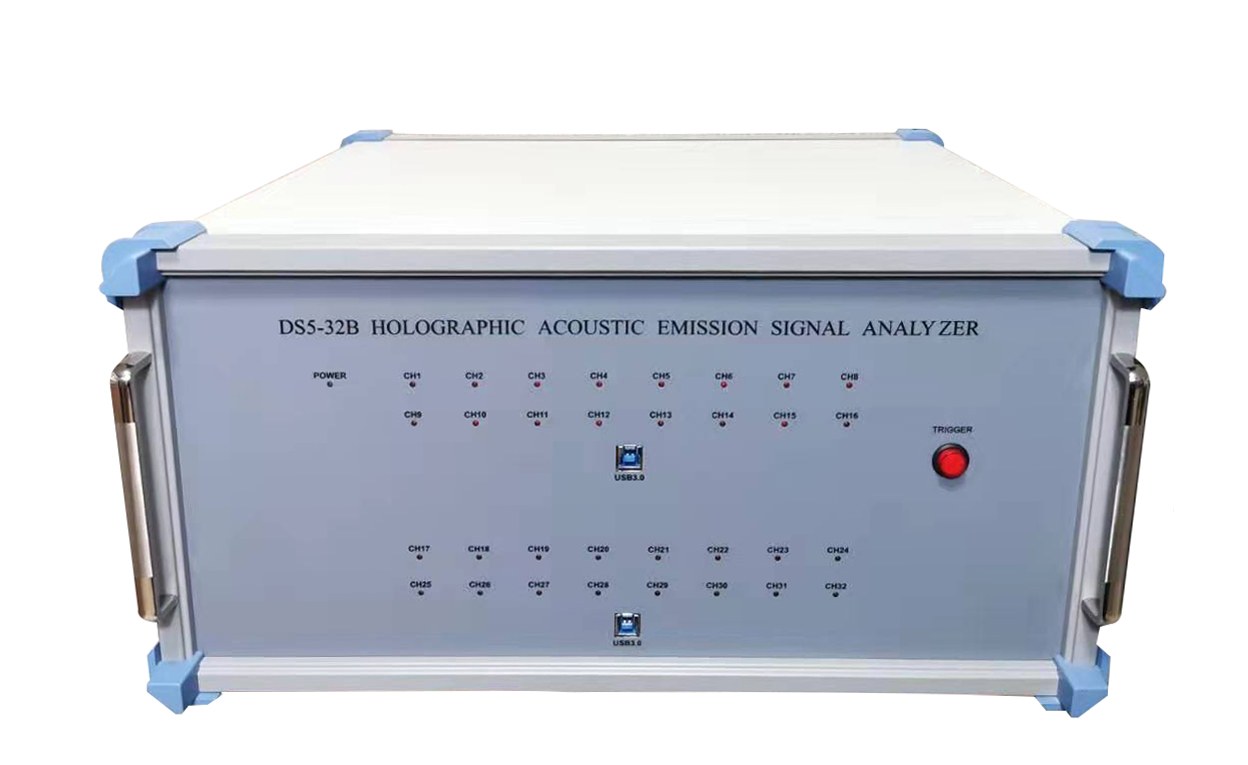
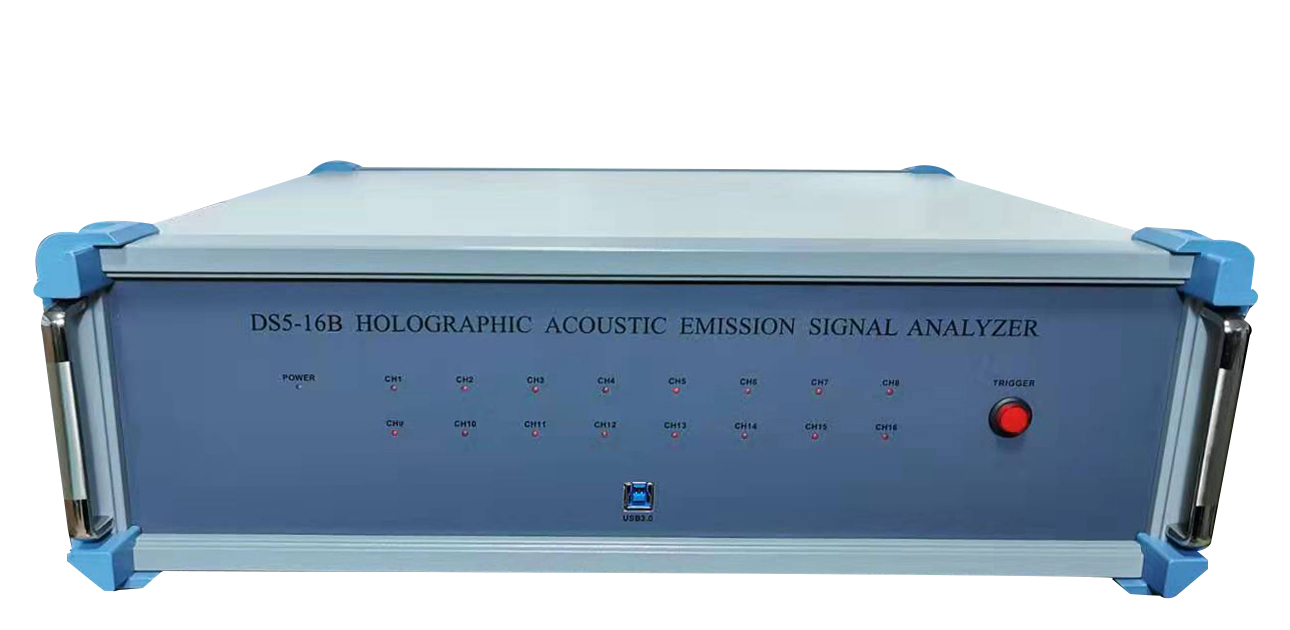
| DS5-32B Full information AE system | DS5-16B Full information AE system | |
 |
 |
|
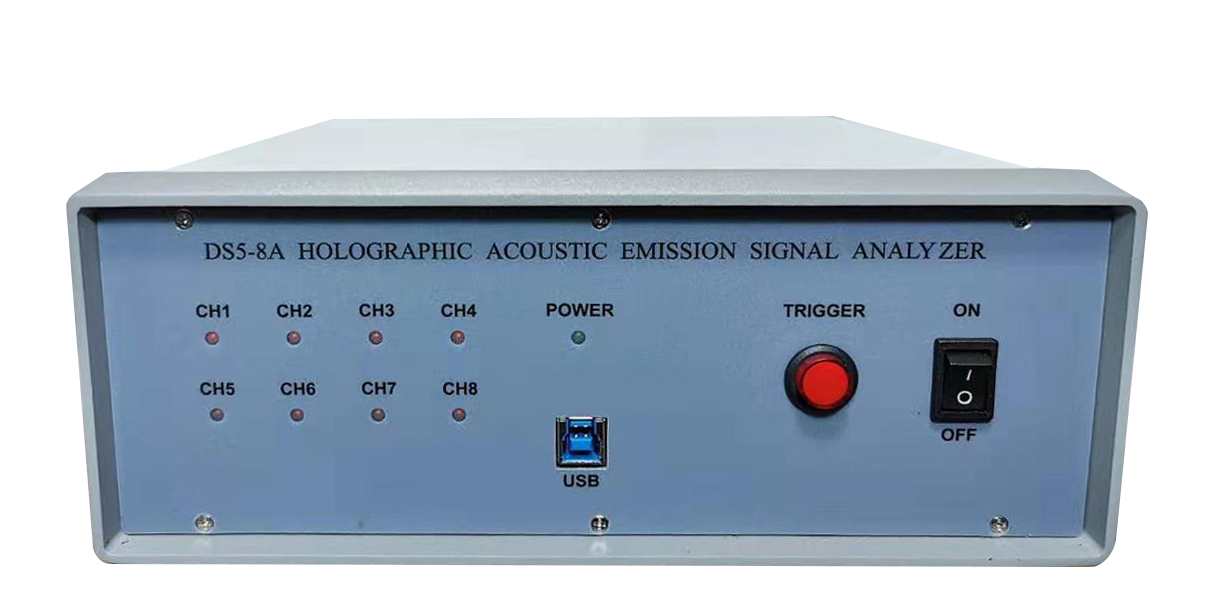
| DS5-8B Full information AE system | DS5-8A Full information AE system |
Technical Index
Model |
DS5-48B |
DS5-32B |
DS5-16B |
DS5-8B |
DS5-8A |
Channels |
2-48 |
2-32 |
2-16 |
2-8 |
|
Continuous data pass rate |
393MB/S |
262MB/S |
131MB/S |
65.5MB/S |
|
Waveform data pass rate |
288MB/S |
192MB/S |
96MB/S |
48 MB/S |
|
Interface type |
USB3.0 interface |
||||
Data collection method |
Multichannel synchronous acquisition |
||||
Software operating environment |
win7、8、10(64bit)operating system |
||||
Continuous collection and storage length |
All waveform acquisition, all channels can continuously store waveform data for several hours, ensuring no data loss during the period |
||||
Sampling rate |
Use 12 channels with |
Use 8 channels with |
Use 4 channels with |
Use 2 channels with |
|
Number of external reference channels |
24 channels |
16 channels |
8 channels |
8 channels |
/ |
External reference sampling frequency |
60KHz、50KHz |
30KHz、 25KHz |
/ |
||
External parameter conversion accuracy |
16bit |
/ |
|||
External parameter input range |
±5V或±10V |
/ |
|||
Input signal range |
±10V |
||||
A/D conversion accuracy |
16bit |
||||
Sampling trigger method |
Signal threshold triggering, external triggering |
||||
Host system noise |
± 1 sampling resolution, i.e. ± 0.308mV |
||||
Channel input impedance |
50Ω |
||||
Nonlinear error of A/D conversion |
±0.5LSB |
||||
Signal input type |
single-ended |
||||
Operating temperature range |
0℃~50℃ |
||||
Power supply mode |
External 220V power supply |
||||
Advantages of DS5 series products
1. The current maximum number of channels for the USB3.0 interface acoustic emission instrument can reach 48, with a data pass rate of up to 393MB/s.
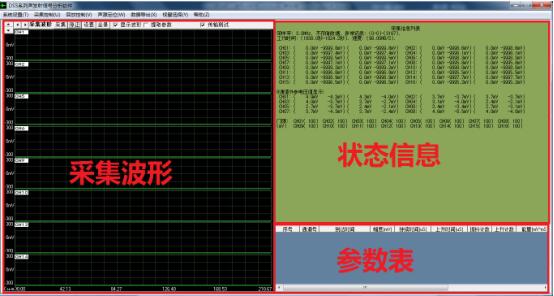
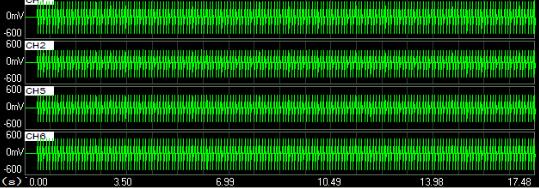
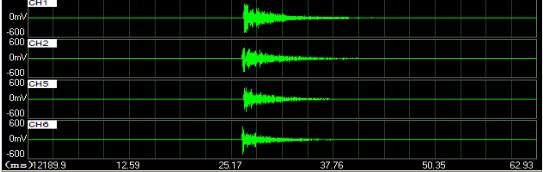
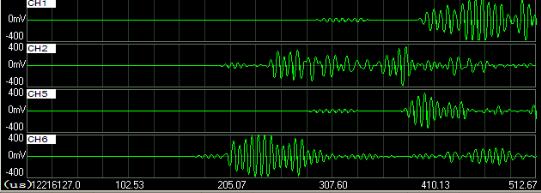
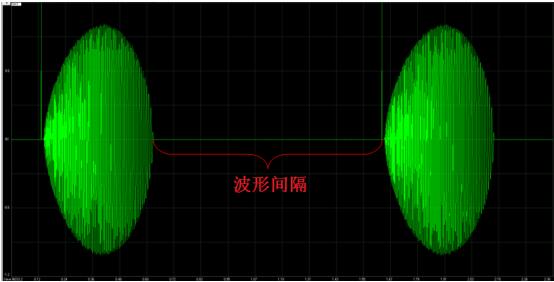
2. All waveform acquisition allows for convenient observation of the panoramic contour and waveform details of acoustic emission signals. After the experiment, the threshold can be reset for playback based on the waveform to avoid experimental errors caused by blindly setting the threshold before the experiment.
3. The collected data can be analyzed using the acoustic emission signal analysis software provided by our company, or all or any selected waveform data can be exported for analysis using tools such as Matlab. The data export format can choose binary or text format.
4. The DS5 C series includes arbitrary wave emission function (arbitrary wave emission function: refers to the acoustic emission host being able to emit waveforms of any shape. It includes waveforms of different frequencies and shapes (square wave, sine wave, exponential wave, logarithmic wave, etc.). Users can edit waveforms of any shape, download them to the acoustic emission host, and the acoustic emission host will stimulate the sensor to generate any waveform.)
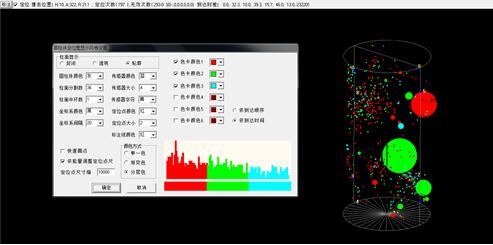
5. Damage localization point size: Divide the localization point size proportionally based on the energy of the localization point.
6. Damage location color: The damage location can be displayed in different colors with arrival time, which can clearly distinguish the damage location points in the early, middle, and late stages of the experiment.
7. Regional positioning: For objects with irregular shapes and uneven textures, the software can achieve regional positioning and display the number of acoustic emission damage points in each area in the graph. The larger the number, the different colors will be used to determine which area is more severely damaged.
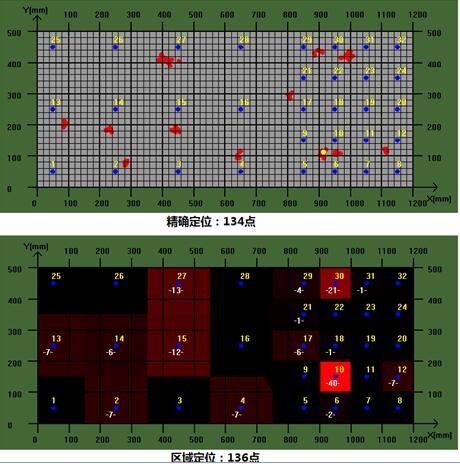
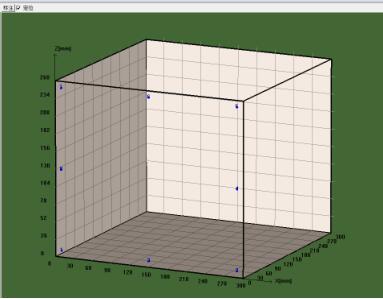
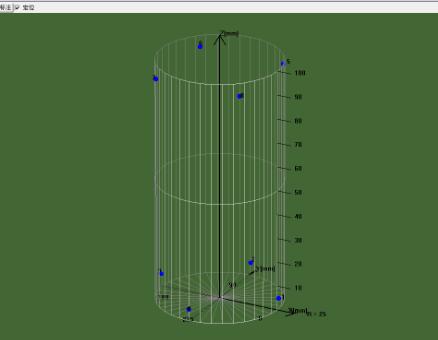
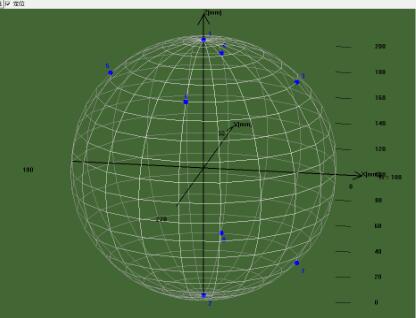
8. Rich positioning models and precise positioning of damage points.